Visualization
MusPy supports two visualization tools. Both use Matplotlib as the backend for flexibility.
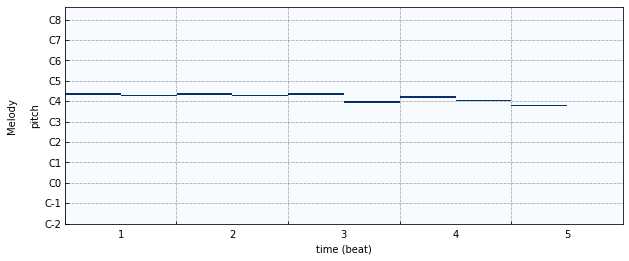
Piano-roll Visualization
The piano-roll visualization is made possible with the Pypianoroll library.
-
muspy.show_pianoroll(music: Music, **kwargs)[source] Show pianoroll visualization.
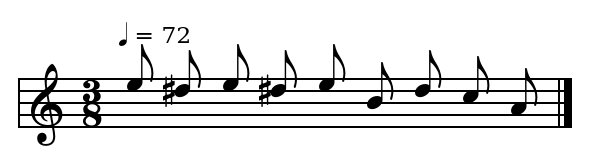
Score Visualization
The score visualization is made possible with the Bravura font.
-
muspy.show_score(music: Music, figsize: Tuple[float, float] = None, clef: str = 'treble', clef_octave: int = 0, note_spacing: int = None, font_path: Union[str, pathlib.Path] = None, font_scale: float = None) → muspy.visualization.score.ScorePlotter[source] Show score visualization.
Parameters: - music (
muspy.Music) – Music object to show. - figsize ((float, float), optional) – Width and height in inches. Defaults to Matplotlib configuration.
- clef ({'treble', 'alto', 'bass'}, default: 'treble') – Clef type.
- clef_octave (int, default: 0) – Clef octave.
- note_spacing (int, default: 4) – Spacing of notes.
- font_path (str or Path, optional) – Path to the music font. Defaults to the path to the downloaded Bravura font.
- font_scale (float, default: 140) – Font scaling factor for finetuning. The default value of 140 is optimized for the default Bravura font.
Returns: A ScorePlotter object that handles the score.
Return type: - music (
-
muspy.ScorePlotter(fig: matplotlib.figure.Figure, ax: matplotlib.axes._axes.Axes, resolution: int, note_spacing: int = None, font_path: Union[str, pathlib.Path] = None, font_scale: float = None)[source] A plotter that handles the score visualization.
-
muspy.fig¶ Figure object to plot the score on.
Type: matplotlib.figure.Figure
-
muspy.axes¶ Axes object to plot the score on.
Type: matplotlib.axes.Axes
-